1 Patient360 Healthcare Dashboard
Dashboard 1: Patient Overview
The Tableau healthcare dashboard example provides an overview of patient statistics within a healthcare system. This dashboard has a professional design, probably which has been created using Figma. It includes:

- Total number of patients, procedures, encounters, and visits.
- Demographic breakdown of patients by gender and average age.
- A list of total procedures conducted with a count for each.
- Encounters are broken down by type, such as stress or employment status.
- A breakdown of service providers by the number of visits.

Dashboard 2: Patient Portal
The second Tableau dashboard example offers a detailed view of a single patient’s medical history. It features:
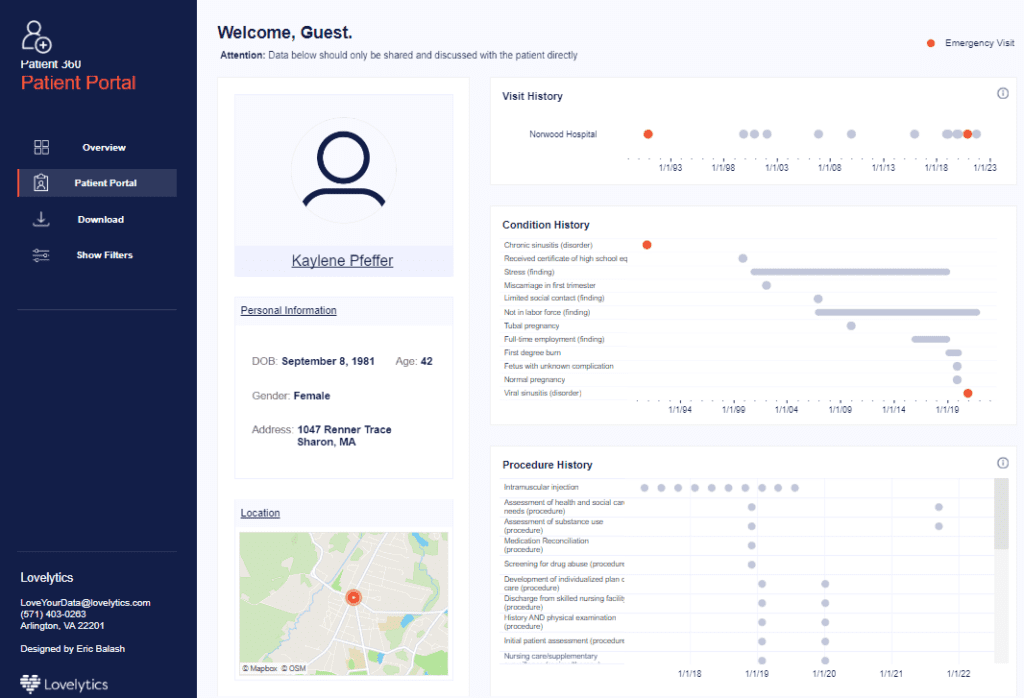
- Personal information of the patient.
- Visit history highlighting the frequency of visits to a hospital.
- A timeline of the patient’s condition history and procedures.
- A location map indicating the patient’s address.
Business Utility
For Healthcare Providers
These dashboards could significantly enhance a healthcare provider’s ability to manage patient data. They can improve patient tracking, identify trends in treatments, and facilitate resource allocation based on procedure frequency and visit patterns. Additionally, they can monitor the demographics of their patient base and adjust services to meet those needs better.
For Patient Care
Having detailed individual patient histories accessible through a portal can aid in personalized care planning, quick access to medical history for emergencies, and better patient-provider communication.
Beneficiaries
- Medical Staff and Administrators can utilize the overview dashboard to streamline operations, manage patient flow, and optimize scheduling.
- Doctors and Nurses can use the patient portal to review individual patient histories before appointments or treatments.
- Patient Relations Managers can analyze data to enhance patient satisfaction and engagement strategies.
- Healthcare Data Analysts can leverage this data to conduct studies on healthcare trends and outcomes.
Types of Charts
- Line Charts – These are used to display the trends over time for various metrics such as “Total Patients”, “Total Procedures”, “Total Encounters”, and “Total Visits”. Each chart has points indicating specific data entries over the two dates displayed, August 29, 2021, and February 27, 2022.
- Donut Charts – This chart is used to show the distribution of patients by gender. It clearly divides the total number of patients into male and female categories, enhancing the visual understanding of gender distribution among patients.
- Bar Charts – Multiple bar charts are utilized to represent data such as the “Average Age” of patients, number of “Procedures” by type, “Encounters” by finding, and “Visits” at various health facilities. These charts help compare different categories visually, making it easy to assess which categories are more significant or require attention.
2 Healthcare – Length of Stay
Dashboard Contents
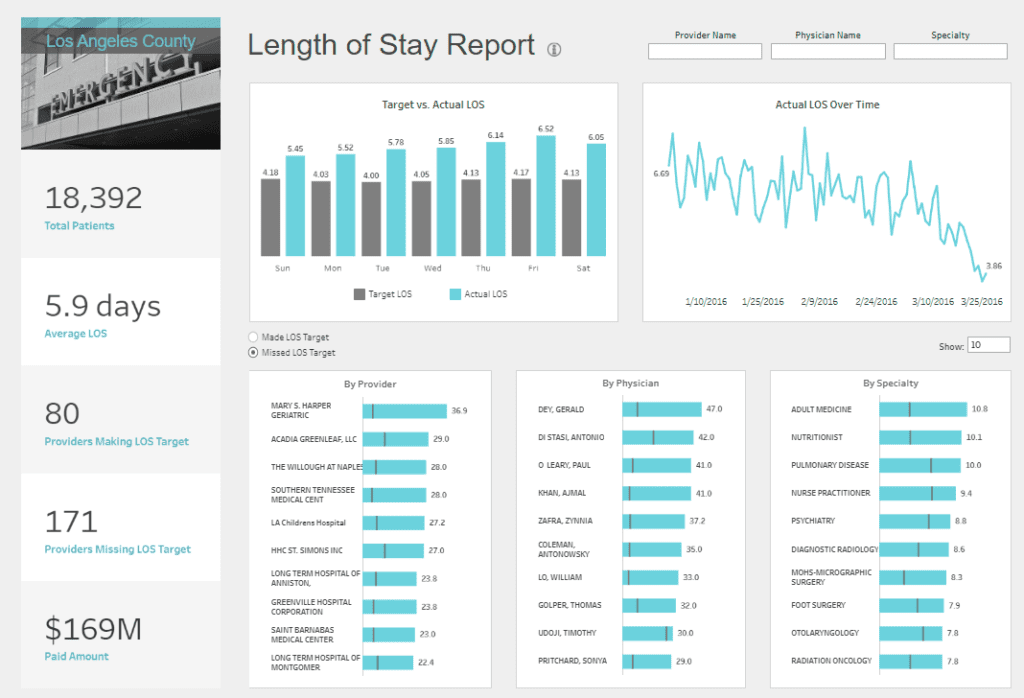
The dashboard is a comprehensive Length of Stay (LOS) Report for a healthcare facility. It includes the following sections:
- Total Patients: The number of patients treated.
- Average LOS: The average length of stay for patients.
- Providers Making LOS Target: The number of providers who met the target length of stay.
- Providers Missing LOS Target: The number of providers who did not meet the target length of stay.
- Paid Amount: The total amount paid for services.
- Target vs. Actual LOS: A bar chart comparing the daily target LOS with the actual LOS for each day of the week.
- Actual LOS Over Time: A line graph showing the fluctuation of the actual length of stay over time.
- LOS Target Achievement: A bar graph indicating the number of providers who met or missed the LOS target.
- Performance by Provider, Physician, and Specialty: Bar graphs that rank providers, physicians, and specialties by their performance related to LOS.
Business Utility
This LOS report is a valuable tool for managing hospital efficiency and patient care. It allows healthcare administrators to track and analyze the duration of patient stays against targets, which is crucial for optimizing hospital bed management, improving patient outcomes, and controlling costs. Understanding LOS patterns can also aid in staffing decisions and predicting future patient care needs.

Beneficiaries
- Hospital Administrators can use this dashboard to monitor and improve hospital operations and patient throughput.
- Medical Staff including doctors and nurses can assess their performance and work towards enhancing patient care.
- Financial Analysts in healthcare settings can analyze the cost implications of LOS and identify areas for financial efficiency.
- Quality Assurance Teams can use this data to ensure the facility meets healthcare standards and patient satisfaction.
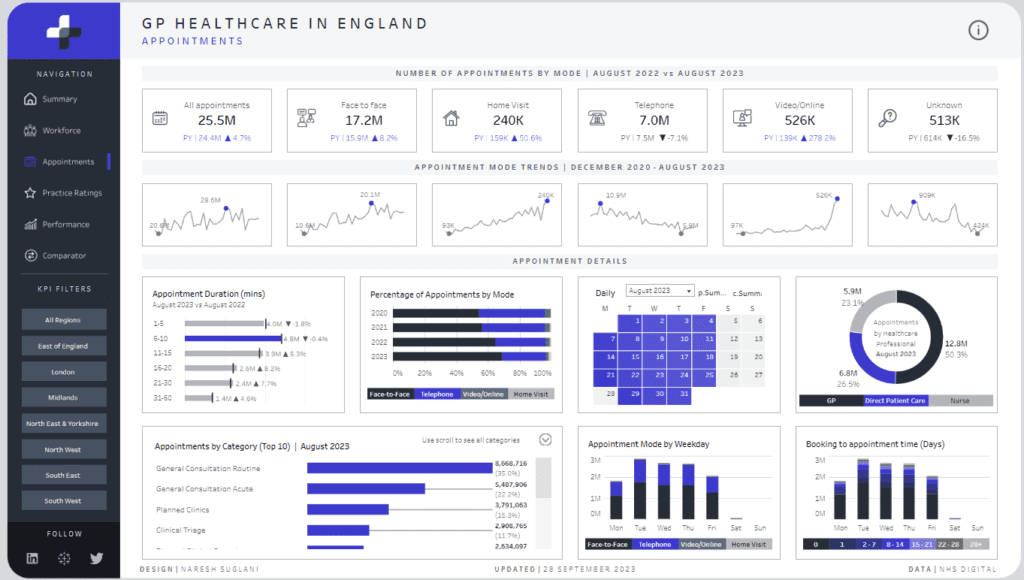
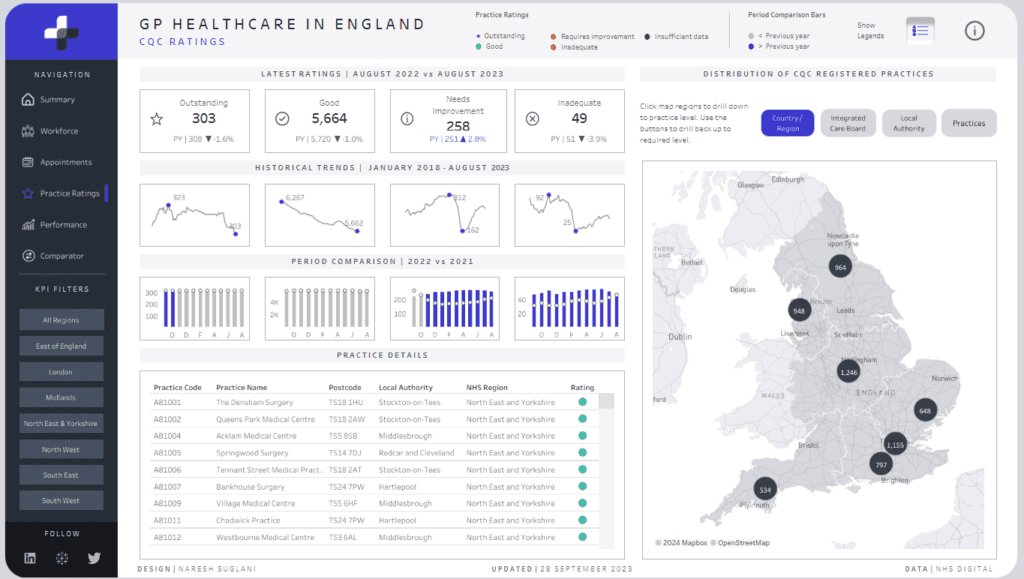
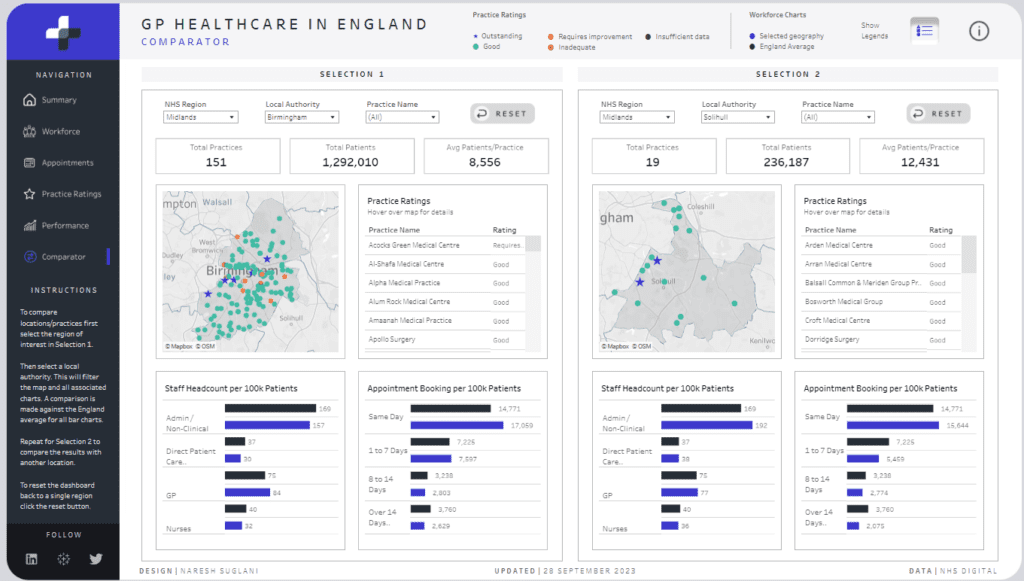
3 GP Healthcare in England
Dashboard Descriptions
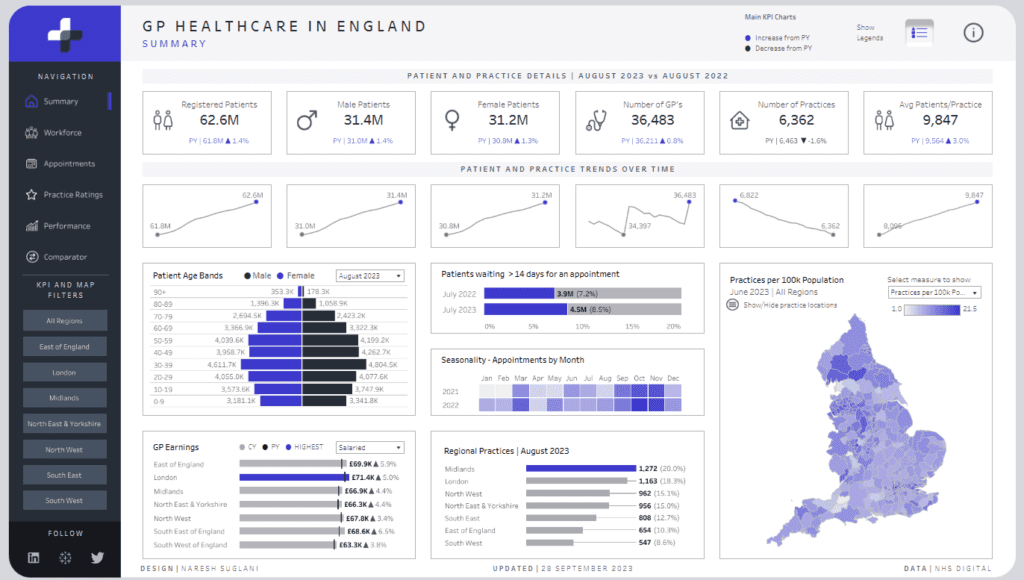
General Practice Healthcare Overview
This Tableau healthcare dashboard example would typically feature key performance indicators (KPIs) such as the number of registered patients, average patient demographics, appointment wait times, visit frequency, and regional distribution of practices. It might also include financial data such as GP earnings and performance metrics like patient satisfaction scores. These dashboards appear to have been created with a Figma background also.
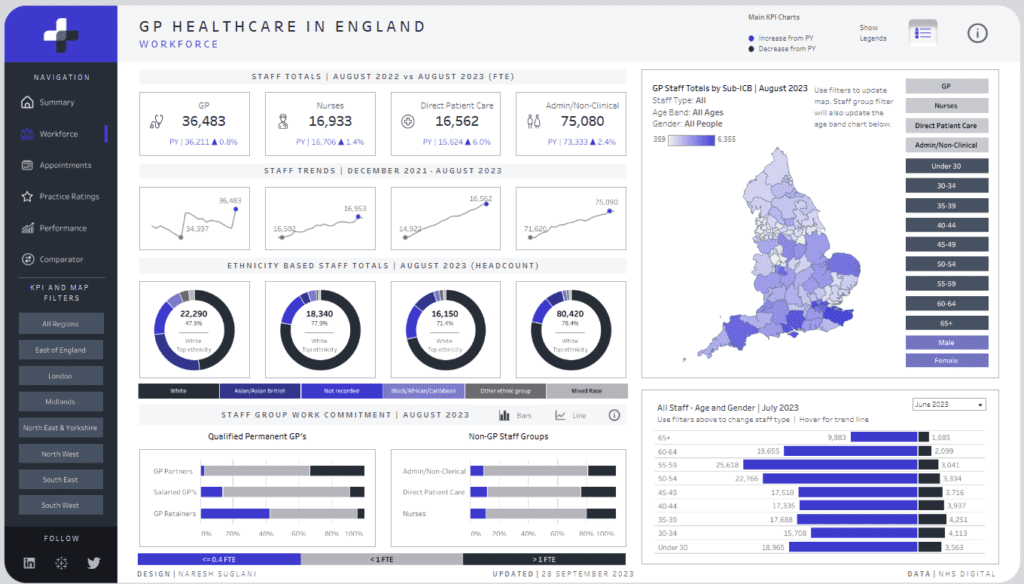
Workforce Analysis
A workforce dashboard in a healthcare setting would likely display the total number of GPs, nurses, and administrative staff, trends in staffing levels, diversity statistics, and other workforce-related metrics such as retention rates and full-time equivalent (FTE) positions.
Types of Charts
- Diverging Bar Chart – This chart is used to display GP earnings across different regions, comparing current year (CY) earnings with previous year (PY) earnings. The bars diverge from a central axis, indicating increases or decreases relative to the previous year, which makes it easy to visualize changes across multiple categories.
- Column Charts – These are used to show the number of registered patients, male and female patients, and the total number of GPs and practices over two different periods (August 2023 vs. August 2022). The columns help compare these figures side-by-side, providing a clear visual representation of year-on-year changes.
- Line Charts – Displayed under “Patient and Practice Trends Over Time”, these line charts track changes over time in metrics such as the number of GPs, the number of practices, and average patients per practice. These charts help visualize trends and fluctuations over a defined period.
Appointment Scheduling and Attendance
This dashboard shows data on appointment bookings, cancellations, no-show rates, appointment types (e.g., in-person, telephone, online), and patient flow throughout the day or week.
Quality of Care and Performance
Another possible dashboard might focus on practice ratings, patient outcomes, service quality indicators, and compliance with healthcare standards.
Comparative Analysis
This type of dashboard allows for comparison between different GP practices or regions, highlighting variations in practice performance, patient demographics, or health outcomes.
Business Utility of Tableau Healthcare Dashboard Examples
Healthcare Administration and Management
Such dashboards are valuable for managing healthcare services efficiently. They provide insights into patient needs, resource allocation, staff performance, and quality of care.
Operational Optimization
Data on appointments and workforce can inform scheduling, optimize patient flow, and improve resource management.
Strategic Planning
Comparative analysis tools support strategic decision-making, enabling healthcare providers to benchmark performance and set improvement goals.
Beneficiaries
- Healthcare Executives would use these dashboards for high-level decision-making and strategic planning.
- GP Practice Managers might rely on these dashboards for day-to-day operational management and staff allocation.
- Clinical Leads could use the data to improve patient care and outcomes.
- Policymakers and Researchers may utilize the data for public health research, policy development, and resource distribution.
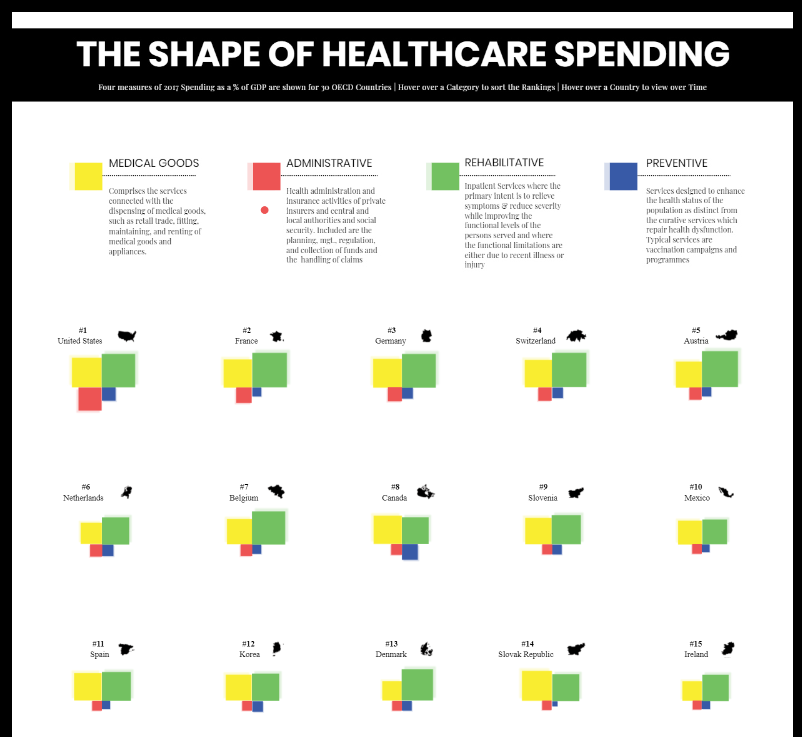
4 The Shape of HealthCare Spending – Tableau Healthcare Dashboard Examples
Dashboard Descriptions
The Tableau healthcare dashboard example presents a comparative analysis of healthcare spending by category across various OECD countries. Typically, such dashboards include:
- Healthcare Spending Categories: Different colour blocks or segments indicate the proportion of spending on various healthcare categories like medical goods, administrative costs, and rehabilitative, and preventive care.
- Country Rankings: A ranking of countries based on the amount of healthcare spending in each category, represented by their flags or names.
- Trends Over Time: Interactive elements to view how spending in each category has changed over time.
Business Utility
For businesses in the healthcare industry or policymakers, this kind of dashboard offers valuable insights into how resources are allocated in different healthcare systems. It can guide decision-making regarding investment, resource allocation, and policy development by comparing the efficiency and priorities of various national healthcare systems.
Beneficiaries of Tableau Healthcare Dashboard Examples
- Healthcare Policy Makers: Can use these insights to understand global trends and develop informed national healthcare policies.
- Healthcare Economists and Analysts: Might analyze the data to study the efficacy of different healthcare spending strategies.
- Healthcare Business Leaders: Can assess market opportunities and competitive landscapes in different regions.
- International Health Organizations: Can leverage this data to recommend best practices and guide global health initiatives.

5 Rural Hospital Closures
Dashboard Descriptions
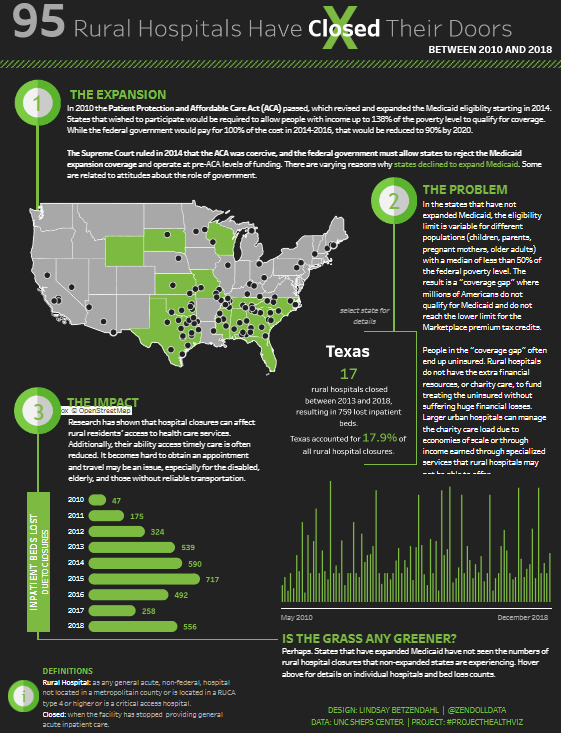
The dashboard is an infographic titled “95 Rural Hospitals Have Closed Their Doors Between 2010 and 2018”. It would typically feature:
- Map Visualization: Showing the locations of rural hospital closures across the United States, with a specific focus on states like Texas, which has a significant number of closures.
- Expansion Explanation: A section detailing the impact of the Patient Protection and Affordable Care Act (ACA) on rural hospitals, including the reduction of federal government payouts over time.
- The Problem: Discussion on the consequences for states that did not expand Medicaid, including higher uninsured rates and increased pressure on hospitals.
- The Impact: Presentation of research findings on how hospital closures affect rural residents’ access to health care services.
- Timeline of Closures: A bar chart showing the number of rural hospitals closed each year from 2010 to 2018.
Business Utility of Tableau Healthcare Dashboard Examples
This dashboard would be useful for healthcare administrators, policymakers, and healthcare strategists to understand the consequences of policy changes on rural healthcare infrastructure. It provides insights into the trends in hospital closures and the broader implications for healthcare access in rural communities.
Beneficiaries
- Healthcare Policy Analysts can use the data to assess the impact of legislation and government policy on healthcare accessibility.
- Hospital Administrators and Health System Planners might leverage the insights for strategic planning, especially in resource allocation and service delivery in rural areas.
- Public Health Officials could use the information to advocate for policy changes or direct attention to underserved areas.
- Healthcare Economists may find the data valuable for research on the economic effects of hospital closures on rural economies.
6 Fitbit Fitness Dashboard | Activity Tracker | Health Analysis
Dashboard Descriptions
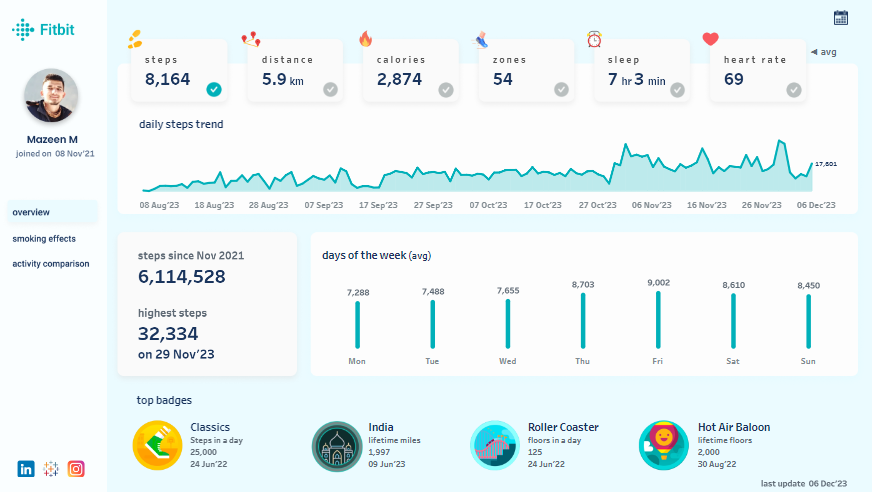
The Tableau healthcare dashboard example are from a fitness-tracking application like Fitbit. They would typically feature:
- Activity Tracking: Including steps taken, distance travelled, calories burned, and active zones achieved. Likely, there would be a daily trend graph for steps.
- Health Metrics: Such as sleep duration and patterns, resting heart rate, and heart rate variations over time.
- Workout Analysis: Comparison of different types of activities, like badminton versus weights, including total sessions, average zones per session, and average heart rate.
- Lifestyle Impact: Analysis of the effects of smoking on health metrics or comparison of activity levels on smoking versus non-smoking days.
Business Utility
For businesses in the health and wellness sector, such dashboards provide comprehensive data to understand user engagement with fitness products. This information can inform product development, marketing strategies, and customer engagement initiatives.
Beneficiaries of Tableau Healthcare Dashboard Examples
- Personal Trainers and Health Coaches can use this data to tailor fitness and health plans for their clients.
- Product Managers at fitness tech companies can analyze user behavior to enhance app features and services.
- Healthcare Providers might use the data for patient monitoring and lifestyle counseling.
- Insurance Companies could leverage health data for wellness programs and to set premiums based on lifestyle choices

7 NHS Hospital Admitted Patient Care Activity
Dashboard Descriptions
Based on the description, the dashboard appears to be a visualization of NHS hospital-admitted patient care activity. It would typically include:
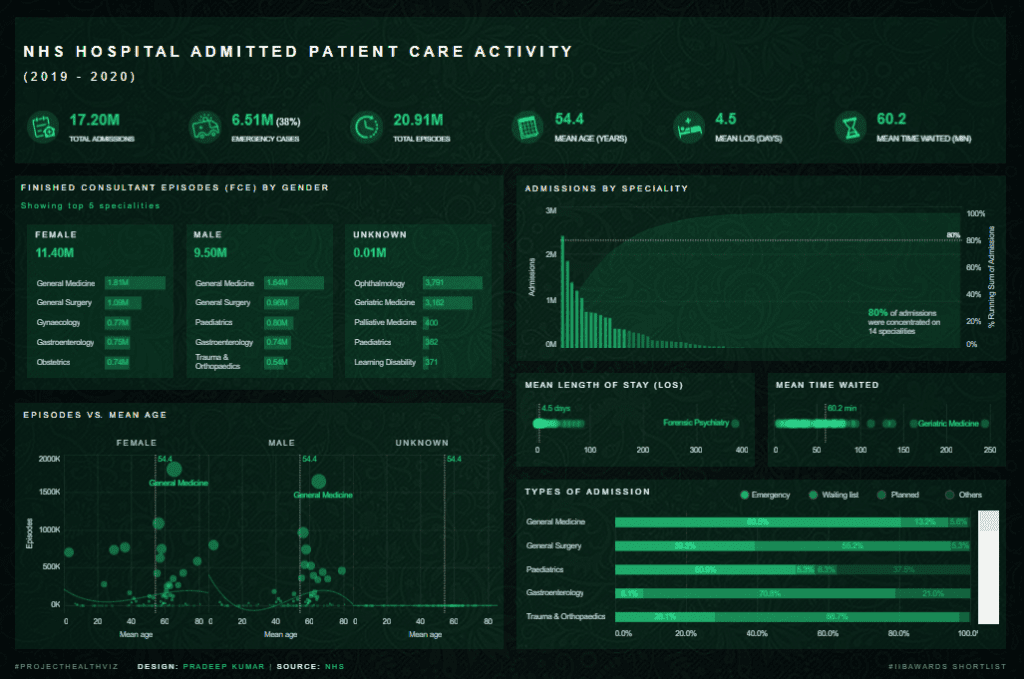
- Total Admissions: The number of patient admissions to the hospital during a specified time frame.
- Emergency Cases: A subset of total admissions that were classified as emergency cases.
- Total Episodes: The total number of completed patient care episodes.
- Finished Consultant Episodes (FCE) by Gender: A breakdown of patient episodes completed, categorized by gender and medical specialty.
- Mean Age and Mean LOS: The average age of patients treated and the mean length of stay in the hospital.
- Admissions by Specialty: A bar chart showing the number of admissions per medical specialty.
- Episodes vs. Mean Age: A scatter plot correlating the number of episodes to the mean age of patients for different specialties.
- Mean Time Waited: The average wait time for patients by specialty.
- Types of Admission: A breakdown of the types of admissions (emergency, waiting list, planned, etc.).
Business Utility of Tableau Healthcare Dashboard Examples
For the NHS and healthcare providers, this dashboard is an essential tool for understanding patient demographics, managing hospital capacity, and streamlining patient flow. It helps in identifying high-demand specialties, allocating resources effectively, and setting priorities for emergency and routine care.
Beneficiaries
- Hospital Administrators: Use this data to optimize staffing, and resource allocation, and improve patient flow management.
- Healthcare Policy Makers: Can assess the effectiveness of healthcare policies and where changes might be needed.
- Medical Consultants and Specialists: Might use the information to understand patient demographics within their specialty and to plan services accordingly.
- Public Health Researchers: Could analyze the data for trends in healthcare needs and the impact of interventions on patient outcomes.
8 Coronavirus (COVID-19) Cases
Dashboard Descriptions
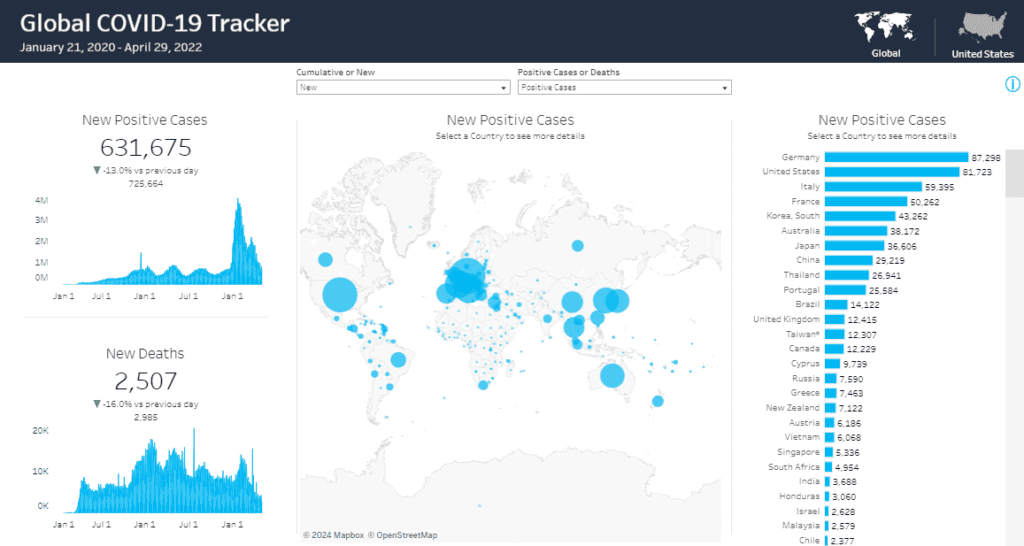
The described dashboard is a “Global COVID-19 Tracker” which would typically include:
- New Positive Cases: A count of the latest reported COVID-19 cases, with a comparison to the previous day and a histogram showing the trend over time.
- New Deaths: Similar to cases, this would show the number of new deaths reported, with a day-to-day comparison and a trend graph.
- World Map Visualization: This would illustrate new positive cases geographically, with bubble sizes representing case numbers in respective countries.
- Country-specific Data: A sidebar or table listing new positive cases by country, allowing users to select a country for more detailed data.
Business Utility
This dashboard provides real-time tracking of the pandemic, which is crucial for businesses that require up-to-date information to navigate the evolving situation. It can aid in risk assessment, strategic planning, and decision-making, especially for businesses with international operations or those in the healthcare sector.
Beneficiaries
- Public Health Officials and Epidemiologists can monitor and respond to emerging outbreaks or trends.
- Business Continuity Planners can use the data to implement workplace safety measures and adjust operations accordingly.
- Logistics Managers can anticipate and mitigate supply chain disruptions due to pandemic hotspots.
- Travel Industry Professionals might adjust services based on the latest travel advisories and restrictions.
- The General Public can stay informed about the pandemic’s progression both locally and globally.
9 Disease-Related Death
Dashboard Descriptions of Tableau Healthcare Dashboard Examples
The dashboard displays a series of choropleth maps representing the percent change in deaths per 100,000 people from 1980 to 2014 in the United States, broken down by county and specific health conditions:
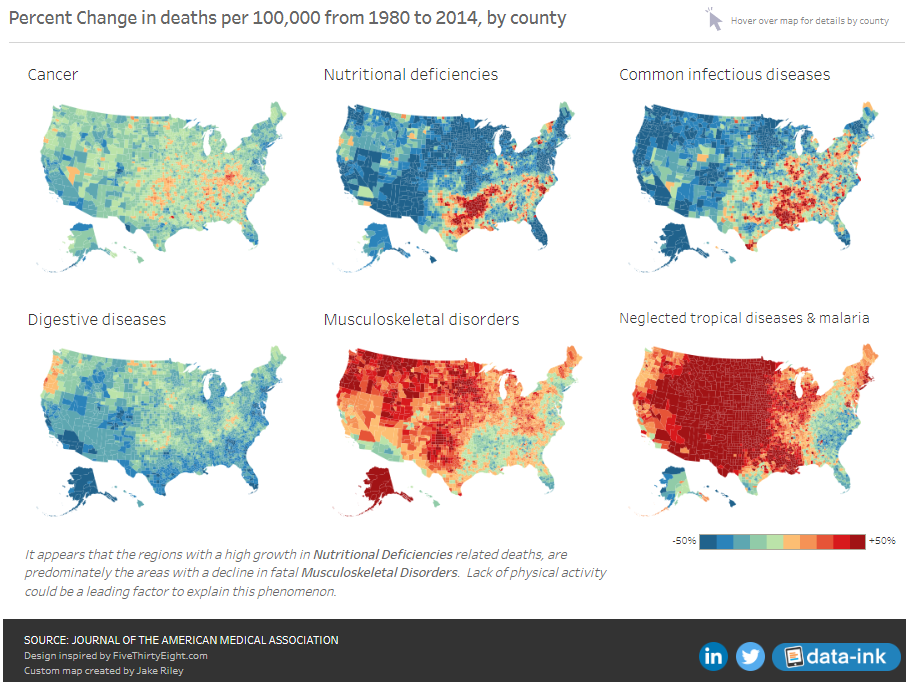
The colour coding on the maps indicates areas of increase or decrease in death rates for each condition, allowing for a visual comparison of health outcomes across different regions.
Business Utility
Such a dashboard can be particularly useful for healthcare businesses, including pharmaceutical companies, healthcare providers, and insurance companies, by identifying trends in public health that can influence business strategies such as targeted drug development, health services provision, and insurance product offerings.
Beneficiaries
- Public Health Officials: To monitor trends in health outcomes and allocate resources for disease prevention and treatment.
- Healthcare Providers and Hospitals: For planning healthcare services and interventions tailored to regional health needs.
- Pharmaceutical Companies: To guide research and development efforts based on disease prevalence.
- Policy Makers and Researchers: To study the impacts of healthcare policies and socioeconomic factors on public health.
- Healthcare Marketers: To develop targeted campaigns for regions with high incidences of particular diseases.

10 Kidney Transplants Dashboard
Dashboard Descriptions
This dashboard is focused on kidney donation statistics in the United States:
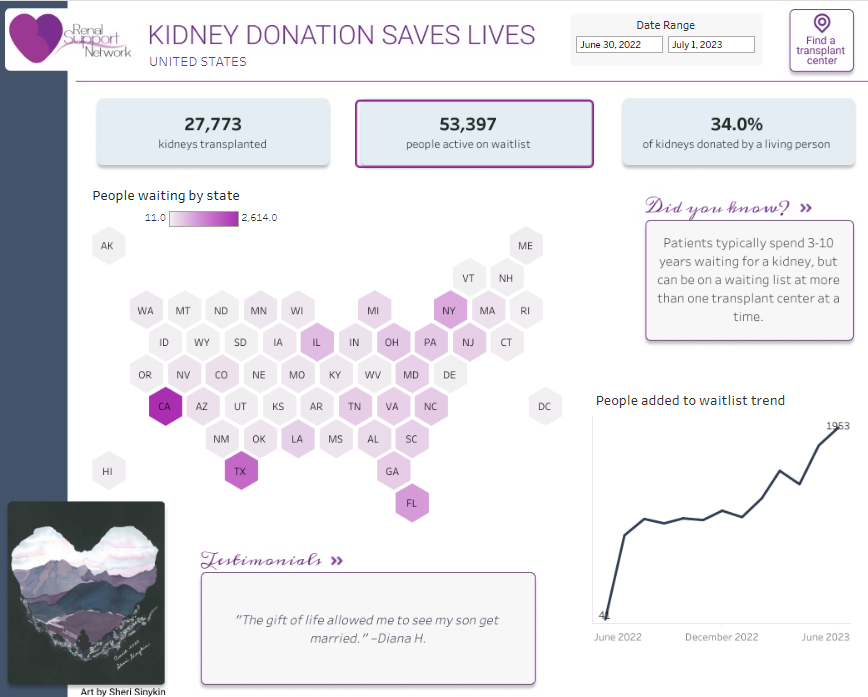
- Kidneys Transplanted: Total number of kidney transplants performed.
- People Active on Waitlist: The number of people currently waiting for a kidney transplant.
- Percentage of Kidneys Donated by Living Persons: The proportion of kidneys donated by living donors versus deceased donors.
- People Waiting by State: A map showing the number of people waiting for a kidney transplant in each state.
- People Added to Waitlist Trend: A line graph depicting the trend of new additions to the kidney transplant waitlist over time.
- Informative Snippets: Facts or trivia related to kidney transplants, such as the typical waiting time for a transplant.
- Testimonials: Personal stories or quotes from individuals who have been impacted by kidney donations.
Business Utility of Tableau Healthcare Dashboard Examples
This type of dashboard is an excellent resource for healthcare organizations, non-profits, and government agencies involved in organ donation and transplantation. It can help track progress, identify areas with high demand, and measure the impact of awareness campaigns and policy changes.
Beneficiaries
- Transplant Centers and Surgeons: Can use this data to understand demand and optimize resource allocation.
- Policymakers in Healthcare: Might leverage this information to make informed decisions about organ donation regulations and support systems.
- Patient Advocacy Groups: Could use the data to raise awareness, support patients, and drive donation campaigns.
- Research Institutions: May analyze trends for academic and clinical research to improve the organ donation and transplantation process.
Tableau Healthcare Dashboard Examples – Conclusion
In conclusion, the ten Tableau healthcare dashboard examples we’ve explored illuminate the profound impact that data visualization has on the healthcare industry. By providing an intersection between complex data and intuitive design, these dashboards empower healthcare professionals to make informed, data-driven decisions swiftly.

From managing patient flow to analyzing treatment outcomes, each dashboard serves as a beacon, guiding the path towards operational excellence and elevated patient care. As we continue to navigate the vast sea of healthcare data, Tableau’s dashboards stand out as essential navigational tools, steering us towards a future where data’s potential to heal and improve lives is fully realized. Don’t hesitate to contact us about creating a healthcare dashboard for your business!
